
Cement, Concrete, and Gravel... Really?
- Erin Greenfield

- Apr 18, 2022
- 17 min read
Why are there big differences in the valuations of building materials companies?

Serious investors who follow stock markets closely usually have a list of companies they would like to buy if they get the opportunity. These “watchlists” often include strong companies with good growth, reputable management teams, juicy profit margins, and high returns that are protected by some competitive advantage. Of course, I am no different. I maintain several watchlists.
I have always found it interesting how some great watchlist companies can trade at very high valuations for long periods of time. In some cases, their valuations just get higher and higher, especially during bull markets.
Often opportunities to buy these companies at reasonable valuations seem to never come. Investors are frequently left with the uncomfortable feeling that they missed their shot.
Faced with this situation many investors plug their noses, close their eyes, and just buy some of these stocks, irrespective of valuation. This behaviour can push the prices of these stocks continually higher. Some investors convince themselves to never sell these stocks, otherwise they might never get another shot at owning these wonderful companies. Stories can start to emerge as to why these companies are so amazing and deserve their crazy-high valuations. They can even become “cult stocks”.
An Example
There are many examples spanning many industries, especially in the American stock market. One I heard of many years ago is Martin Marietta. This company, based in North Carolina, supplies aggregates to the construction industry, mainly in the United States. Aggregates include crushed stone, gravel, and sand. They can be used as a base for roads, and in ready-mix concrete, as well as in asphalt. Aggregates account for the bulk of Martin Marietta’s profits, but the company also sells ready-mix concrete, cement, asphalt, and magnesia-based chemicals. The company has been around for more than 80 years. It used to be part of a conglomerate that was swallowed up in the 1990’s by Lockheed Martin. The latter company quickly spun out the building materials business, which today we know as Martin Marietta.
In Martin Marietta, investors love the idea of the company’s incredible competitive advantage, also referred to as the “moat” around its business. This advantage comes in the form of 350 well-situated stone quarries, mines, and distribution sites. New quarries are difficult to build and open, so it is challenging to increase the supply of aggregates. Because stone is very heavy, yet low in dollar value, it is not economical to transport it over long distances. Therefore, quarries need to be close to where the stone is needed, which is often in major metropolitan centres. Most people in a city do not want a quarry near them, and there are many environmental considerations, so getting permits from all levels of government is difficult. It can therefore take five to eight years to bring a new stone quarry online. Therefore, since supply is often limited, quarries have pricing power, meaning they can easily pass on cost increases and earn handsome margins and high returns without fear of competitors undercutting their prices. Investors love these kinds of stories.
They especially love these stories when reassured by an ever-rising stock price, and Martin Marietta certainly delivers here. Its stock price is up more than 600% since 2005! With performance like that, you would expect the company to have displayed very high growth and high returns. However, later I show that growth and returns for Martin Marietta have not been fantastic, but merely okay. Much of its stock’s performance was achieved from moving to an extremely high valuation. In my opinion, much of the rise was driven by the story, rather than fundamental business performance. There are other building materials companies with slightly lower growth and returns available at substantially lower valuations. For instance, at our firm we own HeidelbergCement, a company based in Germany, which is the global leader in (…you guessed it!) aggregates.
Rather than consider only HeidelbergCement and Martin Marietta, I also compare these companies to Holcim (based in Switzerland), Cemex (based in Mexico), CRH (based in Ireland), and Vulcan Materials (based in Alabama). Vulcan Materials and Martin Marietta are mainly focused on U.S. construction markets, while the other four companies are large multinationals, each with a presence in the U.S. While each company has a different mix of products, they all are involved to some extent in cement, concrete, asphalt, and aggregates.
How Big Are They?
Before jumping into the valuation differential, first consider how these companies compare in size. There are different measurements we can use to compare size including market capitalization, revenues, profits, assets, employees, etc. Below are charts for these measurements (translated into U.S. dollars for comparability where applicable):


From the five charts above, the valuation gap becomes clear. The two U.S-based companies have large stock market capitalizations, but are relatively small when it comes to revenues, income, assets, and employees. The valuation differential becomes starker looking at the table below:

The companies’ valuations relative to one another did not always look like this. Before the global financial crisis (so about 15 years ago), the differences in valuations were not as wide. While stocks of the two U.S. companies were on the more expensive side, they have become more and more expensive over time. Heidelberg’s stock was also on the expensive side back then but got much cheaper over time.
So, why do the stocks of the two U.S. companies trade at such high valuations today? Surely their profit margins and returns are much better? Consider the charts of margins and returns below:

As seen above, the two U.S. companies (especially Marin Marietta) have had better average profit margins than the four multinational companies. However, the chart does not show that margins have been highly cyclical. Margins earned by the two U.S. firms have rebounded towards levels earned before the global financial crisis. Vulcan had the biggest cyclical contraction in margins resulting from the global financial crisis. Heidelberg and Cemex have still not yet rebounded to the profit margins they were earning before the global financial crisis. Margins for both companies are struggling in parts of Europe, and Heidelberg has had problems in Asia, while Cemex is still wrestling with profitability in the U.S. That said, Heidelberg’s profit margins had one of the smallest cyclical contractions resulting from the global financial crisis, so their margins were more consistent on a relative basis.
The chart above uses adjusted earnings before interest and taxes (EBIT). If I also added back depreciation and amortization (to derive EBITDA), the chart would have a similar shape. The conclusions would be the same, although the difference between the top three and bottom three companies would widen out.

An alternative method for measuring profitability is to use companies’ statements of cash flows, instead of their income statements. The chart above shows unlevered free cash flows, which equal cash flows from operations before interest costs, less capital expenditures. The chart is interesting for a couple of reasons. First, it shows the industry generates healthy free cash flows over time. It also shows that Martin Marietta has much lower margins using this metric (versus their operating margins shown earlier). Why? Martin Marietta has been more aggressive in trying to grow organically using capital expenditures and working capital, which both consume cash and therefore suppress cash flows. This is the opposite of Cemex which generated the highest average free cash flow margins. Cemex generated those high cash flows by pulling back on capital expenditures while they tried to fix their balance sheet, which was left damaged by the global financial crisis (more on this later). The difference demonstrates that free cash flow can be misleading. It can mask profitable growth, as well as potential underinvestment. This is one reason I prefer income statement margins calculated using generally accepted accounting principles.

Based on the above chart, none of the companies earned high average returns on invested capital. That said, Martin Marietta clearly earned the highest returns. What this chart also shows is that every company’s returns were dragged down significantly by intangible assets (mainly goodwill). Every company would likely have earned well above its cost of capital (typically, 6-8%) if it were not for these intangible assets. The companies’ intangible assets came almost entirely from expensive acquisitions. Therefore, I would argue several of the companies have destroyed shareholder value by making expensive acquisitions.
Normally, I am not a fan of removing intangible assets when calculating returns, in part because I believe companies and their management teams should be judged on the actual returns they earn (on all their assets). Unfortunately, for several reasons, the precision, usefulness, and comparability of returns are limited, regardless of whether they consider intangible assets. For instance, different companies’ asset bases can be at various stages of underinvestment or overinvestment. Additionally, the extent of accumulated amortization can vary considerably depending on the age of a company or the frequency, size, and recency of it acquisitions. These issues can have a big impact on returns by increasing or decreasing the denominator in the calculations.
Despite the shortcomings of return metrics, I do feel the analysis above shows that the underlying businesses are good businesses over a long period, despite being sellers of cyclical commoditized products.
The higher underlying returns have started to show up in financial results in the last few years as (after investor push-back) some management teams have started to steer away from mega-sized value-destroying acquisitions, and as markets have continued to rebound from the global financial crisis. Most of the management teams now regularly track and communicate return on invested capital. Interestingly, only Martin Marietta has seen a deterioration in its recent returns versus the averages shown in the chart above (finishing 2021 in the middle of the pack, at just over 7%).
What About Growth?
So, I have compared each companies’ profitability, but how does the growth of each company impact relative valuation? Several of the companies show high absolute growth in revenues, earnings, and assets over time. However, much of this growth came from acquisitions of subsidiary companies. As I said, I believe some of these acquisitions destroyed shareholder value. Therefore, we need to be careful not to give management credit for such growth. Some of these acquisitions were paid for by issuing new common shares, which can be dilutive. Some of the companies used debt to pay for acquisitions, with some stretching their balance sheets too much. This was especially a problem before the global financial crisis. To varying degrees, all six of the companies felt the need to raise dilutive equity financing to fix their balance sheets during 2009. The chart below shows how shares outstanding have changed over time:

All the companies have seen large changes in their shares outstanding. This is the opposite of what I would normally like to see. Some of the increases helped pay for acquisitions of subsidiary companies, and some of the increases came from issuing new common equity to repair damaged or risky balance sheets. I would prefer that companies are able to pay for their acquisitions out of their cash flows. And of course, I would prefer our companies always maintain only safe amounts of debt that will allow them to survive crises without issuing more common shares at depressed prices. I prefer to see share reductions over time because they are usually a sign that companies have high cash flows and therefore excess cash can be used to buy back shares. That said, I acknowledge that share issuances can create value if used to buy good assets at attractive prices.
From the bullets below, it becomes apparent that all the companies took on too much risk before the global financial crisis. As mentioned, they all felt the need to raise new equity capital during 2009:
Cemex bought RMC in the UK in 2005 for $4.6 billion and Rinker in Australia in 2007 for $14.2 billion. The deals were financed with debt and Cemex almost went bankrupt in the ensuing global financial crisis, suffering from the economic recession but also Mexican peso devaluation and problems with their derivatives. They were forced to sell their Australian assets to Holcim at a depressed $1.8 billion in 2009, and they raised dilutive equity financing that same year by selling common shares for $1.8 billion, increasing their share count by 19%. It seems they were basically locked out of debt markets for 10 years, as they did not raise any debt financing from 2008 to 2017 (not even for maturity management, which is odd).
CRH made numerous sizeable acquisitions for cash in 2005, 2006, 2007 and 2008. During the ensuing financial crisis, they raised dilutive equity financing in 2009 by selling common shares for $2 billion, increasing their share count by 31%. The company did not return to doing acquisitions until 2015 when they bought assets divested out of the merger of Lafarge and Holcim for $6.5 billion, as well as C.R. Laurence in California for $1.3 billion.
Heidelberg bought Hanson in the UK in 2007 for $16 billion. This left their balance sheet in terrible shape during the global financial crisis. Their controlling shareholder at the time, Adolf Merckle, was at one point the sixth richest person in Germany. During the crisis, he was forced to sell much of his shares to meet margin calls, and tragically committed suicide in early 2009. Later that year, the company raised dilutive equity financing by selling common shares for $3 billion, increasing their share count by 50%. The company did not return to doing acquisitions until 2016 when they bought Italcementi for $4.1 billion.
Holcim made sizeable acquisitions for cash in 2005, 2006, 2007, 2008, and 2009. During the global financial crisis, they raised dilutive equity financing in 2009 by selling common shares for $2 billion, increasing their share count by 18%. The company did not return to doing acquisitions until 2015 when they bought the massive French company Lafarge for $44 billion. That deal was paid for entirely by issuing common shares, increasing Holcim’s share count by 77%.
Martin Marietta’s capital allocation in the few years before the financial crisis was better than that at the other firms. They did not make significant acquisitions just before the financial crisis. However, they were buying back their own shares in 2005 through 2007, only to later raise equity financing in 2009 by selling common shares that increased their share count by 9%. The large increase in shares outstanding shown in the chart above came from their 2014 purchase of cement company Texas Industries, paid for by issuing common shares which increased shares outstanding by 45%.
Vulcan was also buying back their own shares in 2005 and 2006. The company then took on debt and issued shares to purchase Florida Rock for $4.7 billion in 2007. Vulcan also raised equity financing in 2009 by selling common shares that increased their share count by 14%.
The events outlined above show the dangers in making large acquisitions when cyclical markets (in this case, construction) are booming. Doing large deals financed by debt can lead to later being forced to issue common shares at depressed prices to heal overextended balance sheets.
Recessions are a fact of economics. They are unpredictable. Companies should always be prepared to face them.
Considering the changes in shares outstanding shown in the chart above, I feel absolute measures of growth can be misleading and not comparable. What is more important in my opinion is determining if companies have grown on a “per share basis”. Therefore, I consider growth in revenue per common share, as well as growth in earnings per common share in the following two slides:

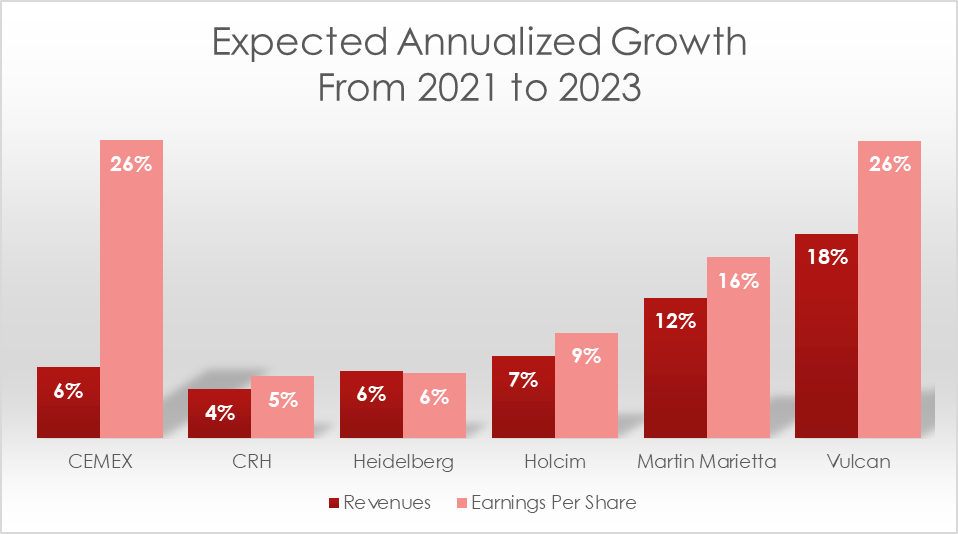
Above, we can see that Martin Marietta had the most growth in revenue per share. And below, we can see Martin Marietta also had the most impressive growth in earnings per share. Their management has likely added value on a per share basis. However, while their growth was quite good, it was not fantastic, and I do not believe it is evidence that the company’s stock should trade at a very high valuation. Martin Marietta’s stock has a valuation comparable to those of Microsoft, S&P Global, and Accenture, all of which saw much higher earnings per share growth over the same period.

On the other end of the spectrum, it seems from the previous two growth charts that capital has been mismanaged at several of the firms. Shareholders at Cemex and Holcim have been particularly diluted over time (mainly due to the Rinker and Lafarge deals, respectively).
Acquisitions do not always show up clearly in financial statements. They can appear as an increase in common shares outstanding if they are paid for by issuing new shares to the previous owners. They can also show up in the statement of cash flows if they are purchased using cash. To get a more complete picture of how acquisitive these companies have been, below is a chart of net cash spent on acquisitions over time.

It seems that Cemex, Heidelberg, and Holcim have largely retreated from using cash to pay for acquisitions. This would make sense considering all three of these huge multinationals have been trying to improve their balance sheets for years. However, Heidelberg and Holcim have actually paid significant amounts of cash for acquisitions in 2015 and 2021, respectively. These deals do not show up in the chart above because they were offset by cash received for significant divestitures during the period covered.
Okay, so historical growth per share does not seem to warrant Martin Marietta trading at a huge valuation premium. What about future expected growth? We can see from the chart below that equity research analysts are expecting a significant acceleration of growth at the two U.S. companies. This is due to expectations for a continued strong economy in the U.S. and for a new upcycle in infrastructure construction spending. Due to the high fixed cost nature of the aggregates business (also referred to as high operating leverage), analysts are expecting the superior revenue growth to translate into even higher earnings growth. If these predictions are accurate, then the U.S. companies should trade at some premium. However, I would point out that both equity analysts and the management teams have a history of not meeting their predictions, so it is not clear to me how large this premium should be. Both the U.S. stocks seem vulnerable if the U.S. was to unexpectedly enter a recession. This is possible given the Federal Reserve Board has finally begun to tighten monetary policy to fight high inflation.
So, profit margins, returns, historical growth, and future growth all warrant some premium valuation for Martin Marietta relative to the other companies considered. What about their balance sheet? I think companies with strong balance sheets should be rewarded with higher valuations, as there is less risk of disaster for their shareholders. Below, I look at the most common measure of financial leverage:

We can see from the chart above that Martin Marietta currently has the most levered balance sheet of the companies considered. To me, that warrants a valuation discount, rather than a valuation premium. But there are investors who would argue that if we are heading into a U.S. infrastructure construction super-cycle, you are better to be invested in the most levered companies (both operational leverage through high fixed costs, as well as financial leverage using debt). This is because, those are the companies that will have the most earnings torque. Therefore, some investors would argue you should be willing to pay a premium today for those companies. Maybe, but that is not the way I like to invest. That strategy involves being able to predict macroeconomics and assumes a certain amount of accurate market timing.
I prefer buy-and-hold investing, and therefore I like safe balance sheets in case there is an economic downturn around the corner.
What else could account for the large valuation differences between these companies? A history of accounting charges and impairments is often a sign of mismanagement, which in many cases warrants a valuation discount. Below we can see which companies have a history of such charges and impairments:

Cemex and Heidelberg have incurred the largest cumulative net charges and impairments over time. Earlier, I showed “adjusted” returns on invested capital. That calculation used “operating” earnings, meaning it ignores gains and losses considered “non-operating”. So, if a company has a lot of restructuring charges, impairments, or write-offs, those are ignored in the returns I showed earlier. If I changed that chart to include charges and impairments, Cemex would show average return on invested capital that is 1.4% lower, so only 2.9% over 16 years. That is a large enough difference to warrant a valuation discount, unless we can be very sure Cemex management has changed their ways (I think they have). A similar adjustment would be much less material to Heidelberg’s average return on invested capital, and therefore I would argue a valuation discount is probably not warranted for Heidelberg, especially considering management is no longer pursuing the type of large deals that lead to these charges.
On the opposite end of the spectrum, CRH has recognized net gains over time, likely going to show why CRH’s management team fancies themselves as adept and active traders of businesses.
So, based on all the analysis above, I can say Martin Marietta has the best margins (which are improving), the best returns on invested capital (although nothing special on average, and declining recently), the highest growth per share (although nothing fantastic), and the worst balance sheet (but not terrible). They have likely been managed the best based on their margins, returns, growth, and lack of non-operating charges.
Some Qualitative Considerations
Could anything else explain the valuation differential between these companies? Of course, there are many qualitative considerations. For example, all else equal, investors (including me) prefer U.S. companies over international companies because American companies are more transparent, management are usually more aligned and motivated, and they tend to be more efficient and more capitalistic. Also, Martin Marietta and Vulcan earn a much higher portion of their profits from the U.S. economy, which is easier to track and understand, and has tended to grow faster than international economies over long periods. Companies like HeidelbergCement are much more complex, with a presence in over 50 countries. Investors are not as interested in emerging markets growth anymore and are more attuned to the accompanying political and economic risks. Energy inflation is a more serious problem in Europe (47% of Hiedelberg’s revenues). That said, the U.S. companies are certainly not immune to inflation (e.g., energy, labour, and freight).
All the factors considered together do not justify such a huge valuation difference in my opinion. Heidelberg has a longer operating history. The company is very diversified. It is vertically integrated. Their professional management is good at managing expenses. They are further along in reducing carbon dioxide emissions. They have a safer balance sheet. They pay a more attractive (yet safe) dividend, and they are buying back shares (at a much more reasonable valuation than their U.S. competitors can). HeidelbergCement is actively improving margins and returns, while reducing complexity by exiting businesses where they can not be a clear leader or earn sufficient returns. Over the long-term, growth per share has not been great, but over shorter periods growth per share has been better and should continue to improve. The new Chairman of Heidelberg’s Management Board has sworn off large acquisitions. Unlike Martin Marietta (and Holcim), Heidelberg has not used a significant number of shares to buy other companies in well over a decade.
Of course, investments in HeidelbergCement are not risk-free. One need only look at the share prices of these companies over twenty years. They can be very volatile. Alternatively, just open one of their annual reports. Inside, many risks are listed including competition, cyclicality, politics, regulations, acquisition risks, balance sheet risk, safety risks, environmental risks, etc. I do not pretend shares in HeidelbergCement, or any equity investments, are sure things. However, in my opinion Heidelberg is well-managed and should continue to grow. It has good market positions and attractive underlying economics. We feel the company is a good example of where we can invest to grow your wealth (and ours) over time.
Please contact us if you would like to learn more about our investments in HeidelbergCement or any other company. We would be happy to discuss with you how we decide which companies make it into our portfolios. We are always eager to discuss our investment philosophy and how we feel it can help build wealth over time.
Until next time!
Erin
This material is for general information, illustration, and discussion purposes only. It is provided “as is” to give the reader something to think about and to illustrate our firm’s investment process and strategies. This material is not intended to convey specific investment, legal, tax, or individually tailored financial advice and it should not be relied on as such. The contents of this material should not be relied upon in substitution of the exercise of independent judgment. This material should not be considered a solicitation to buy or an offer to sell a security. Any such offer or solicitation will be made only by means of delivery of an investment management agreement, and only to suitable investors in those jurisdictions where permitted by law. This material does not consider any investor’s particular investment objectives, strategies, tax status, or investment horizon. Past performance is not indicative of future results. The comments herein are not predictive of any future investment performance. The performance of a specific managed account may vary based on the account’s specific holdings and restrictions. Details on the compilation of performance figures are available upon request. This material is based upon sources of information believed to be reliable but no warranty or representation, expressed or implied, is given as to its accuracy or completeness. All beliefs, assumptions, opinions, and estimates contained in this material constitute the judgment of the author as of the date of this publication. All opinions, estimates, information, data, and facts presented in this material are furnished as of the date shown and are subject to change and to updating without notice. They are provided in good faith however we disclaim legal liability for any errors or omissions. No representation is made with respect to their accuracy, adequacy, timeliness, or completeness, and they may not be relied upon for the purposes of entering any transaction. Certain information has been obtained from third party sources and, although believed to be reliable, the information has not been independently verified and its accuracy or completeness cannot be guaranteed. This material contains forward-looking statements, which are subject to important risks and uncertainties that could cause actual results to differ materially from current expectations. No use of the Greenfield Investment Management name or any information contained in this report may be copied or redistributed without prior written approval. Greenfield Investment Management Limited is registered as a portfolio manager with the securities commissions in Ontario and British Columbia. Any investment is subject to risks that include, among others, the risk of adverse or unanticipated market developments, issuer default, risk of illiquidity, and loss of capital. Our firm, directors, officers, and employees may, from time to time, hold the securities mentioned herein. Please see the Legal link in the footer of our website for more detail concerning the disclaimers listed above. We ask clients to please notify us of any changes to your contact information and to your financial situation or your investment objectives which may have an impact on the management of your assets by Greenfield Investment Management Limited.


